A Collection of Things I’ve Built

I turn fragmented signals into decisions

I’m a creative strategist working at the intersection of culture, audience, and data. I take fragmented inputs - social listening, search, trend signals, syndicated and first-party data - and turn them into a point of view that marketing, creative, product, and executive teams can act on.

Download résumé LinkedIn
Table of Contents
01
Briefing Reimagined
Framework design  ·  for Gap Inc.
Fragmented audience signal turned into “Need States,” a decision-ready brief. Adopted seasonally without a mandate; rolled out internationally, with a second brand in test.
02
Framework design
Earned Media Value  ·  for Condé Nast
It started with spotting the gap: publishers would need their own earned-media story to keep pace with influencer marketing, before the market said so. Then vendor RFP, methodology, a productized measure, and GTM integration. Influenced $90M+ in tentpole and event revenue.
03
Product prototyping
Contextual video insights  ·  for Mobian
Prototyped an automated workflow for YouTube ad-exclusion lists. Built solo, then scaled with an engineer. 60 hours to 3 minutes; a Fortune 100 client 5× in a quarter.
04
AI agent automation
GTM reporting workflow  ·  for Mobian
Translated a manual, email-triggered reporting-and-deck process into an autonomous agent, built with Convey. 5 days to 15 minutes.
05
Vogue consumer insight
Bridal survey analysis  ·  for Condé Nast × Anthropologie
Led the analysis of a 2,000-person custom study; advised editorial on the findings that could carry content. Shaped a 3-part Vogue.com series.
01 · Briefing Reimagined

A briefing framework marketers pulled on their own, season after season

Gap’s seasonal brand planning ran on inputs that each told a partial story: social listening, search, audience profiling, market intelligence. I synthesized them into Need States, four plain statements of what consumer messaging had to address that season. Marketers began pulling the materials for their own teams and agencies without being asked, and it rolled out to Gap’s international markets, with a second-brand test underway.

Audience Strategy Cultural Insight Framework Design Executive Advisory
01 / 05
The Problem

Seasonal strategy depended on many signal sources that never resolved into one point of view. Each report described what the audience was doing. None of them said what the work had to do.

Brand marketers and their creative and media agencies didn’t need another data deck. They needed a brief: a shared, decision-ready read on what messaging had to address for the customer that season.

Not “what is the audience doing?” but “what does our messaging need to address?”
The Approach

Layer the signals until the need states surface

Each signal set is partial on its own. Stacked and read against each other, they converge on a small number of underlying needs: the states a season’s messaging has to speak to.

Social Chatter Traveling, socializing, engaging in culture, fleeting moments of summer
Search & Market Signals Pinterest Trends, Google Trends, WGSN category momentum
Audience Affinities Profiling and meta-affinities: music, sport, art & food, travel
Need States Help Me Dream, Support My Identity, Keep Me Connected, Surrender to the Moment
Reconstructed Structure adapted from the original summer methodology slide. Signal examples illustrate the input set; not a full source list.
The Output

Four need states, each with a job for the messaging

Help Me Dream Aspiration, escape Place the product inside a dream state: the trip, the debut, the version of summer they’re picturing.
Support My Identity Cultural capital Back a pillar of who they are: sport, music, art and food. Being fluent in it is the flex.
Keep Me Connected Belonging Show the product inside a community, not on a lone model. The scene is other people.
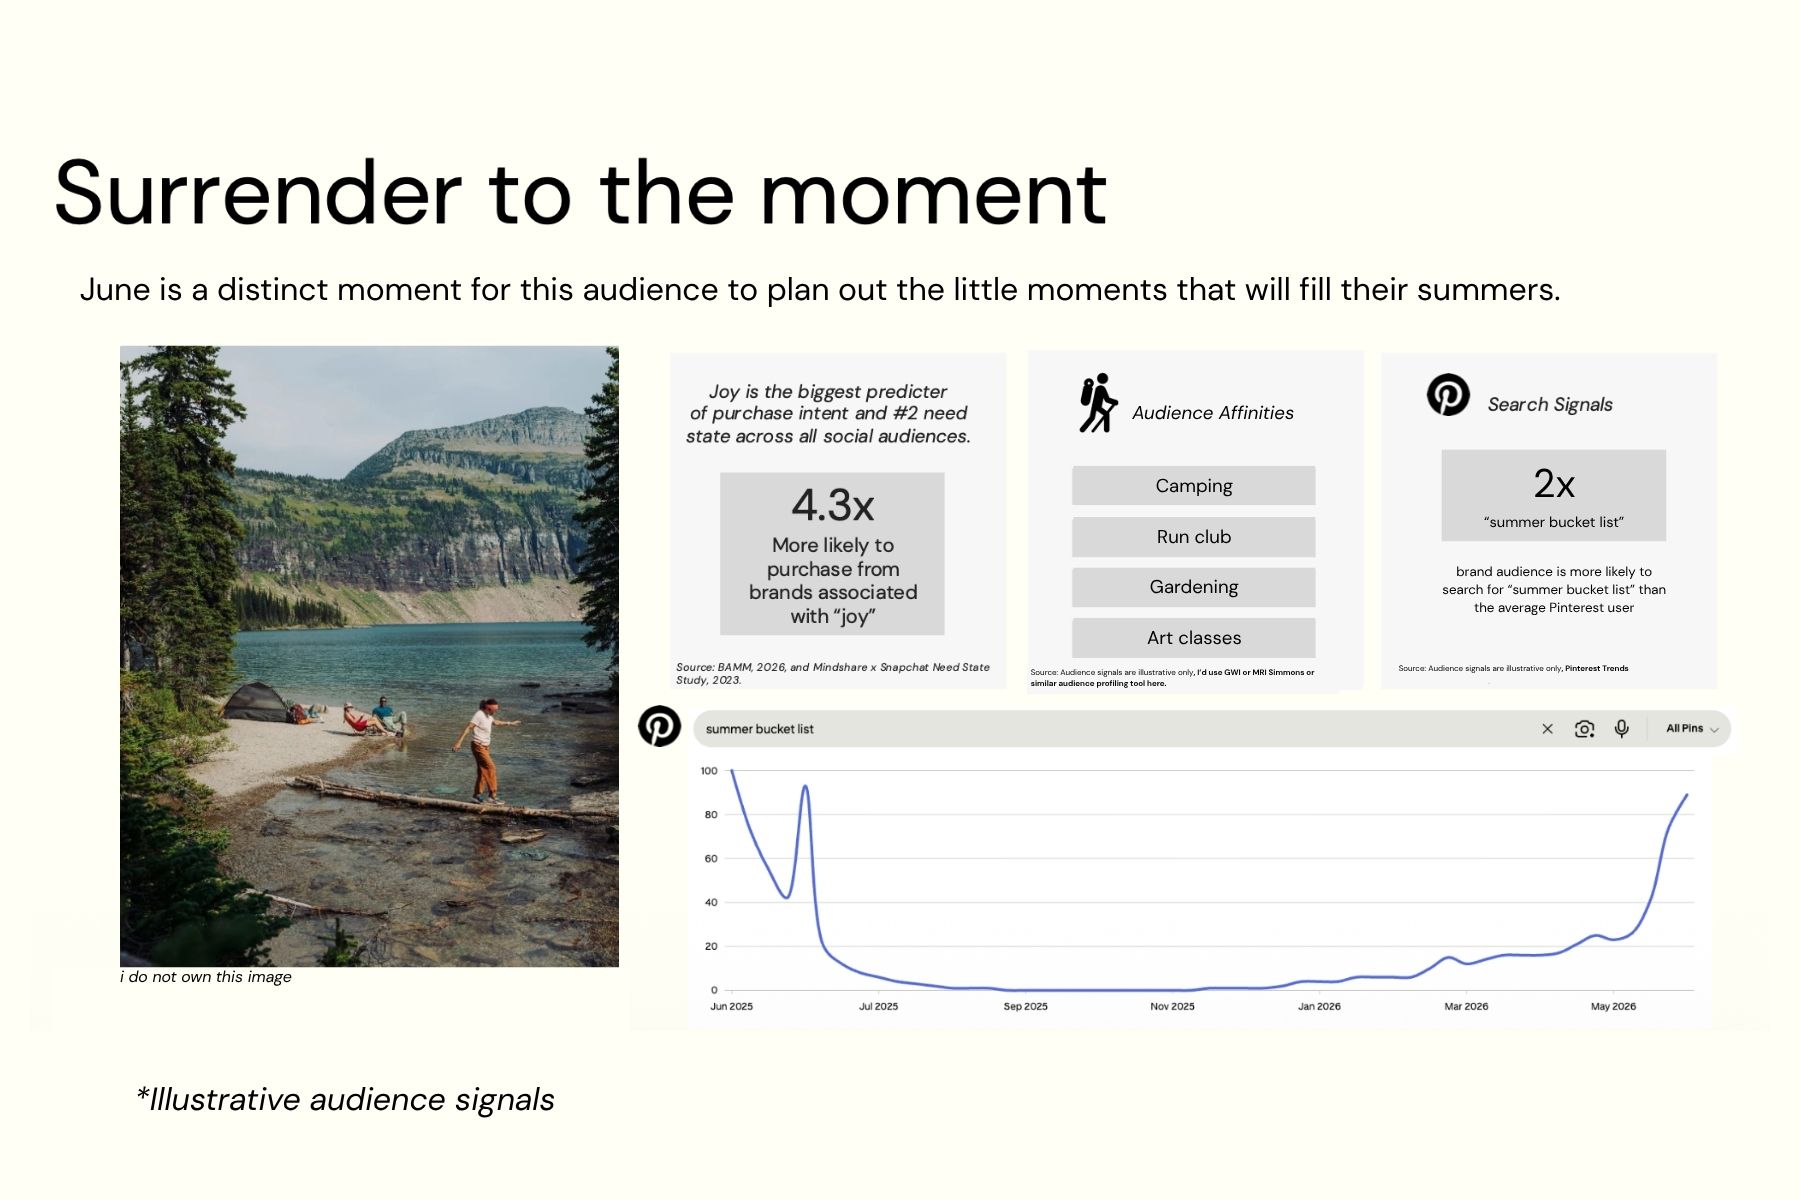
Surrender to the Moment Spontaneity, presence Reward letting go. Surprise and “you had to be there” make the moment feel exclusive.
Illustrative An example of the kind of need states the framework produces. Wording adapted from one season’s output, not a live brief.
Impact

Adopted without a mandate.

Seasonal Marketers pulled the materials themselves, for their own teams and creative / media agencies
Int’l Rolled out to Gap international markets
Expanding Test underway to extend the framework to a second brand

Also used to advise the CMO and marketing leadership on seasonal brand strategy: one point of view built from social listening, EMV, search, audience profiling, and market intelligence.

02 · Framework Design

An earned-media standard, built before the market asked for one

I saw it early: publishers would need their own earned-media story to keep pace with influencer marketing, and Condé Nast had no credible, repeatable way to quantify the earned media its brands and events generate. I ran the build end to end: vendor RFP and evaluation, methodology and best practices, the executive recommendation, productization, and integration into go-to-market. The capability went on to influence $90M+ in tentpole and event revenue.

Measurement Framework Vendor Evaluation Commercial Strategy Executive Advisory
02 / 05
The Problem

Earned Media Value existed as one-off reports, not a standard. No shared methodology, no repeatable output, no agreed read on what the number meant.

To support revenue conversations it had to be consistent, credible across brands and events, and legible to people who don’t work in analytics: sales, editorial, the C-suite.

How do you build a measurement standard when the market doesn’t hand you one?
The Approach

Treat it as procurement and product design, not software selection

Saw the Gap Publishers would need their own earned-media story to keep pace with influencer marketing, before the market demanded it
Business Question How should Condé Nast measure the value of the earned media it generates?
Vendor Landscape DMR, Launchmetrics, CreatorIQ
Evaluation & Testing Methodology, data quality, coverage, scalability, commercial usability
Recommendation A measurement approach and an operating model for using it
Productization Vendor output to standardized measure to repeatable reporting to internal capability
Commercial Integration GTM decks, RFP responses, tentpole events, competitive benchmarks
The Output

A vendor number, turned into a Condé Nast measurement product

External Vendor OutputRaw third-party EMV, per methodology
CN Measurement FrameworkConsistent definitions, benchmarks, best practice
Repeatable ReportingSame shape every event, every brand
Commercial / GTM UseSales materials, RFPs, event storytelling

Where it showed up

March & September advertising-sales GTM materials: EMV vs. competitive benchmarks as preliminary insight
RFP responses to prospective advertisers
Event storytelling for Vogue World and the Met Gala
Client conversations: Estée Lauder Companies, L’Oréal Paris, Gucci, Hermès, Louis Vuitton

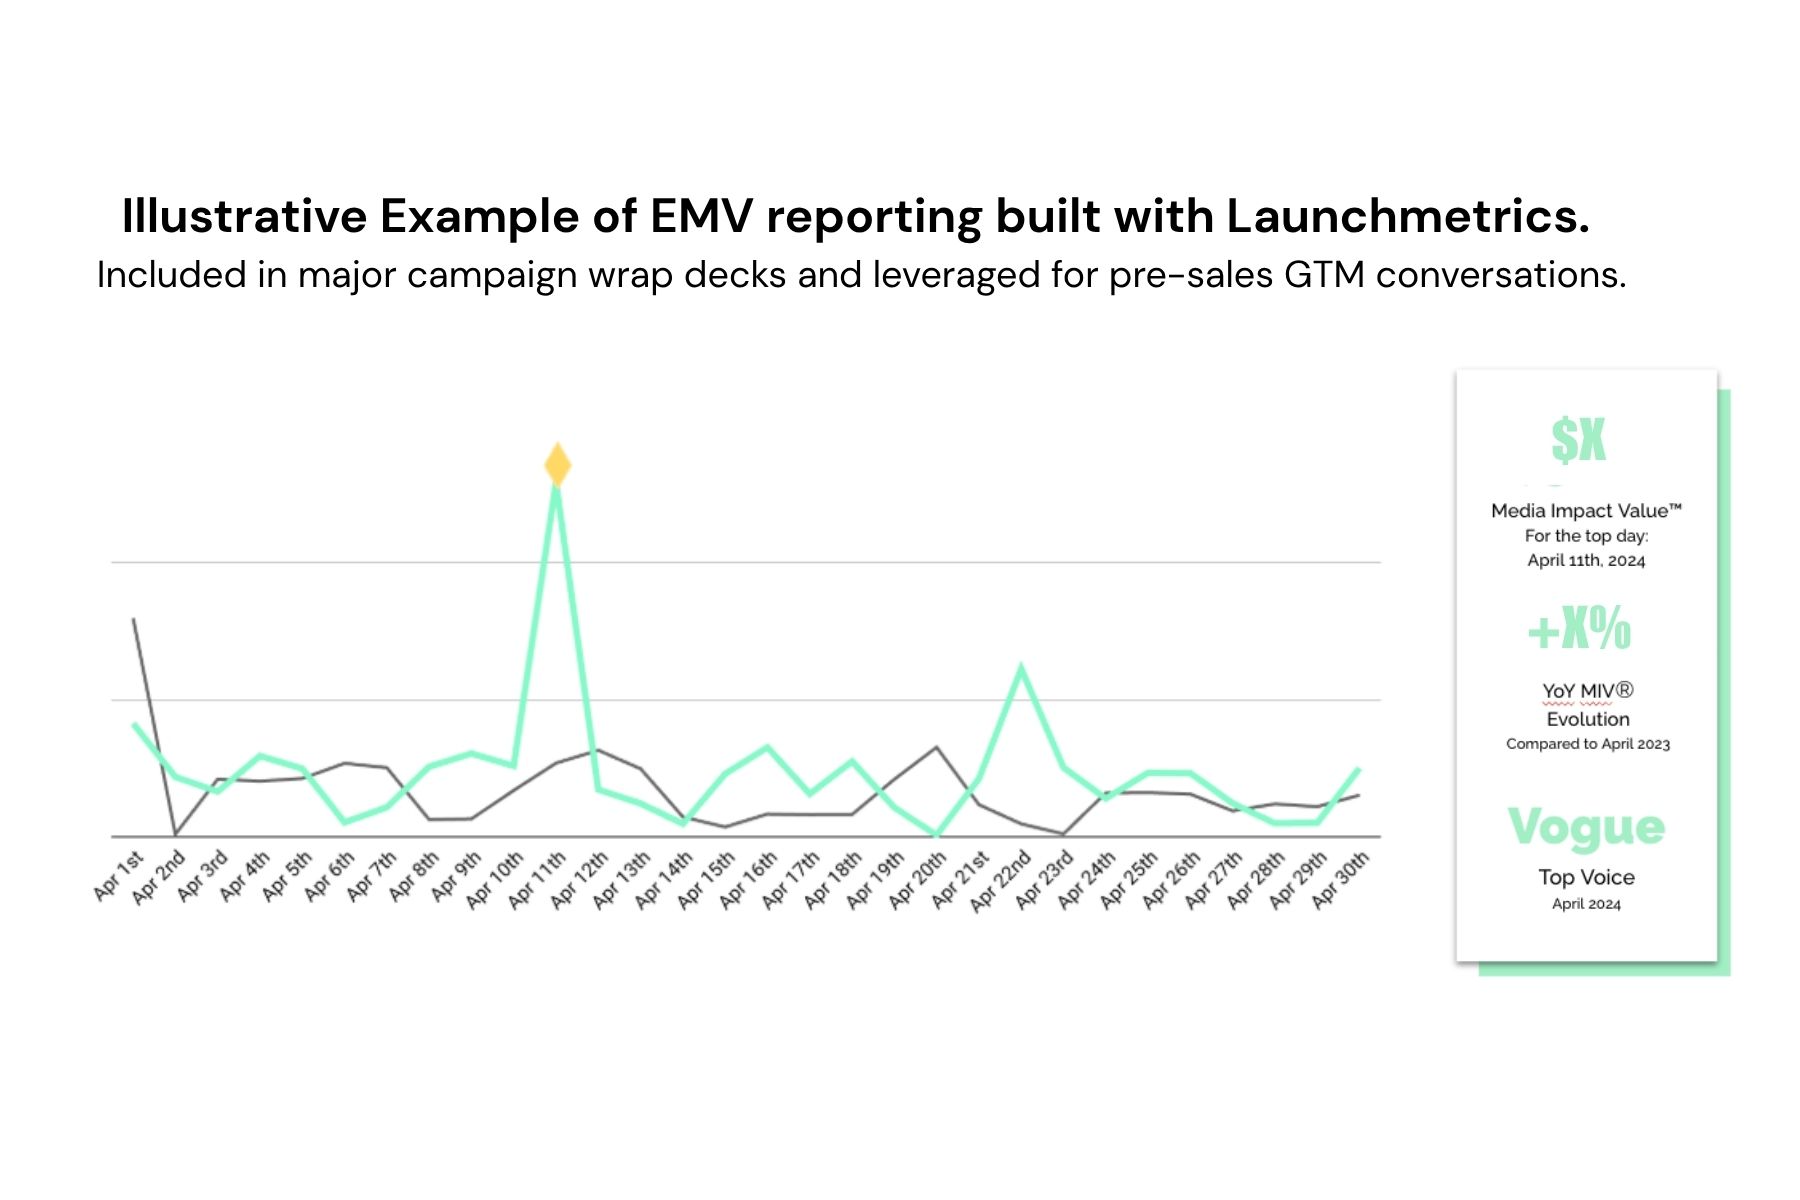
Competitive EMV benchmark, reconstructed shape

Illustrative Layout only; indexed values invented. Shows how the benchmark was framed for sales, not real client or competitor figures.
Impact

From an analytics output to a commercial instrument.

$90M+Tentpole & event revenue influenced
AdoptedAcross Condé Nast’s secondary markets, after executive buy-in

Embedded in go-to-market for major moments including Vogue World and the Met Gala, and in RFP responses to prospective advertisers.

03 · Product Prototyping

From 60 hours to 3 minutes, and a deeper read of where ads ran

YouTube ad-exclusion lists (the channels a campaign refuses to run on) were built by hand, one channel at a time, in reviews that took up to 60 hours. I prototyped a workflow that queried Mobian’s enriched database directly and generated the list in about three minutes. I built the first version solo, then hardened it with an engineer once it needed to scale.

AI Product Development Insights Automation Prototype → Scale Client Strategy
03 / 05
The Problem

The manual process: an analyst reviewed channels and videos one by one, then compiled the exclusion list. Up to 60 hours per campaign, and the output was a flat list with no read on why a placement was wrong. It was already AI-supported, but off best practice, with no pipeline behind it.

“Brand-safe” wasn’t the same as “brand-fit.” In one campaign analysis, most spend landed in low-risk, positive content that still missed the target audience: a large share went to children’s content, and almost none to product-relevant environments.

Safe inventory can still be the wrong inventory.

Brand-safe didn’t mean brand-fit

Spend on children’s content~half
Spend on product-relevant contentunder 1%
Illustrative Directional: a picture of what I was looking for. Exact percentages, spend and client identity withheld.
The Approach

Replace the review with a query, and build a layer that produces insight

Before
Manual channel reviewAI-supported, but off best practice, with no pipeline
Manual compilationHand-built exclusion list
~60 hoursPer campaign
After
Pull from Mobian dataVideo- and channel-level, straight from the enriched database
Transformation layerTurn Mobian’s contextual signals into campaign insight
Exclusion list + PoP trackingRefined list, plus period-over-period performance
~3 minutesPer campaign
Before ~60 hrs
After ~3 min
The Output

Re-pointing the spend

The workflow made it easy to move budget off misaligned placements and toward environments that matched the brand and audience.

List scale

Start ~50K
Scaled 600K+

Exclusion-list entries, after the prototype was hardened with an engineer and scaled as a product.

Impact

A prototype that became the way the work got done.

~60h → ~3mExclusion-list turnaround, per campaign
50K → 600K+Exclusion-list entries after scaling
Fortune 100 CPG client footprint, in a single fiscal quarter

Built solo as a prototype, then refined for production with a dedicated engineer once it had internal buy-in.

04 · AI Agent Automation

A 5-day reporting workflow, run by an agent in 15 minutes

The GTM team kicked off reporting and deck creation by email, then waited about five days while it was built by hand. Working with Convey, I translated that manual process into an autonomous agent: it takes the email trigger, runs the analysis, and returns a client-ready deck in roughly 15 minutes. The work was defining what the agent should do, in what order, and to what standard.

AI Product Development Agent Design Workflow Automation Process Translation
04 / 05
The Problem

Reporting was manual and email-triggered. Pulling the data, building the analysis, assembling the deck and reviewing it ran to about five days each cycle.

Strategic account work couldn’t scale while people spent days hand-assembling mechanical outputs. The constraint wasn’t the thinking, it was the production.

The bottleneck wasn’t the analysis. It was the assembly.
The Approach

Turn a business process into an agent’s operating spec

Before
GTM request by emailManual kickoff
Manual reportingPull, clean, analyze by hand
Manual deck buildAssemble & format slides
Review · ~5 daysPer cycle
After
Email triggerBrand name and waste definitions, over email
Autonomous agentBuilt with Convey
Analysis + deck buildRuns the workflow to standard, in Google Slides
Client-ready deck by email · ~15 minBack to the requester’s inbox
Before ~5 days
After ~15 min
The Output

What the agent runs

Automating the workflow meant decomposing it into stages an agent could run reliably, and deciding what “good” looked like at each one.

Input The brand name and the brand’s own waste definitions, across supported dimensions only. A target persona in mind, not a written brief.
Automated analysis Run the performance logic and detect wasted spend against the brand’s definitions.
Deck + narrative building Generate the headlines, auto-plot the visuals, and assemble a client-ready deck in Google Slides, delivered back to the requester’s inbox.
Impact

A manual GTM workflow, now an autonomous system.

~5 daysManual reporting & deck creation, before
~15 minSame output, agent-run, after
~480×Faster turnaround, order of magnitude

Built with Convey. Zoe’s role was translating the business process into an automatable workflow and defining how the agent should execute it.

05 · Vogue Consumer Insight

A 2,000-person bridal survey, turned into a Vogue series that outperformed

Anthropologie Weddings and Vogue polled more than 2,000 engaged and recently married brides to understand how style fits the wedding-planning journey. I led the analysis and advised editorial and client stakeholders on which findings mattered, the ones that could carry content. The survey shaped a three-part Vogue.com series, and the wardrobe story became one of Vogue Weddings’ top-performing articles of the period.

Consumer Research Insight → Editorial Content Strategy Client Advisory
05 / 05
The Problem

A rich custom dataset (2,000+ respondents drawn from Vogue insiders, Anthropologie and fellow URBN customers) and a brand partner, but no content strategy yet.

The survey spanned the full bridal journey. Editorial needed a point of view: which findings were interesting enough to build stories around, and what was the through-line that held them together?

A dataset isn’t a story until someone decides what it’s about.
The Approach

Find the through-line, then let it shape the editorial direction

2,000+ respondents Vogue insiders, Anthropologie & URBN customers, engaged or recently married
Analysis What’s the through-line across the whole journey?
The insight The wedding isn’t one day, it’s a sequence of events, each needing its own look
Editorial direction Dress for every moment, engagement party to goodbye brunch

The findings that carried it, all publicly reported

Brides planning 4+ events beyond the wedding day: engagement photos, rehearsal dinner, honeymoon, bachelorette ~2 in 3
Name “romantic” as their wedding theme, with “bohemian” on the rise 35%+
Have two or more dresses for the ceremony and reception ~half
Say the transition to the after-party calls for an outfit change ~66%
Plan a bridal party of 5+, and of that group, 22% larger than 10 63%
PR Newswire, 13 Mar 2023 · Vogue.com, Anthropologie Weddings sponsored series
The Output

One idea: a look for every moment of the journey

The published article followed the sequence the analysis surfaced: each event on the bridal calendar as its own styling moment, in order.

Engagement shootNamed the first big moment by ~70%
Engagement party
BacheloretteYounger brides drove an uptick in gifting the bachelorette crew
Rehearsal dinner
Ceremony to receptionWhere the multiple-dress finding lives
After-party
From the analysis The bachelorette gifting trend among younger brides is directional from the survey read; no figures shown.
Impact

Research that set the editorial agenda, and performed.

3-partVogue.com series shaped by the survey analysis
Top
performer
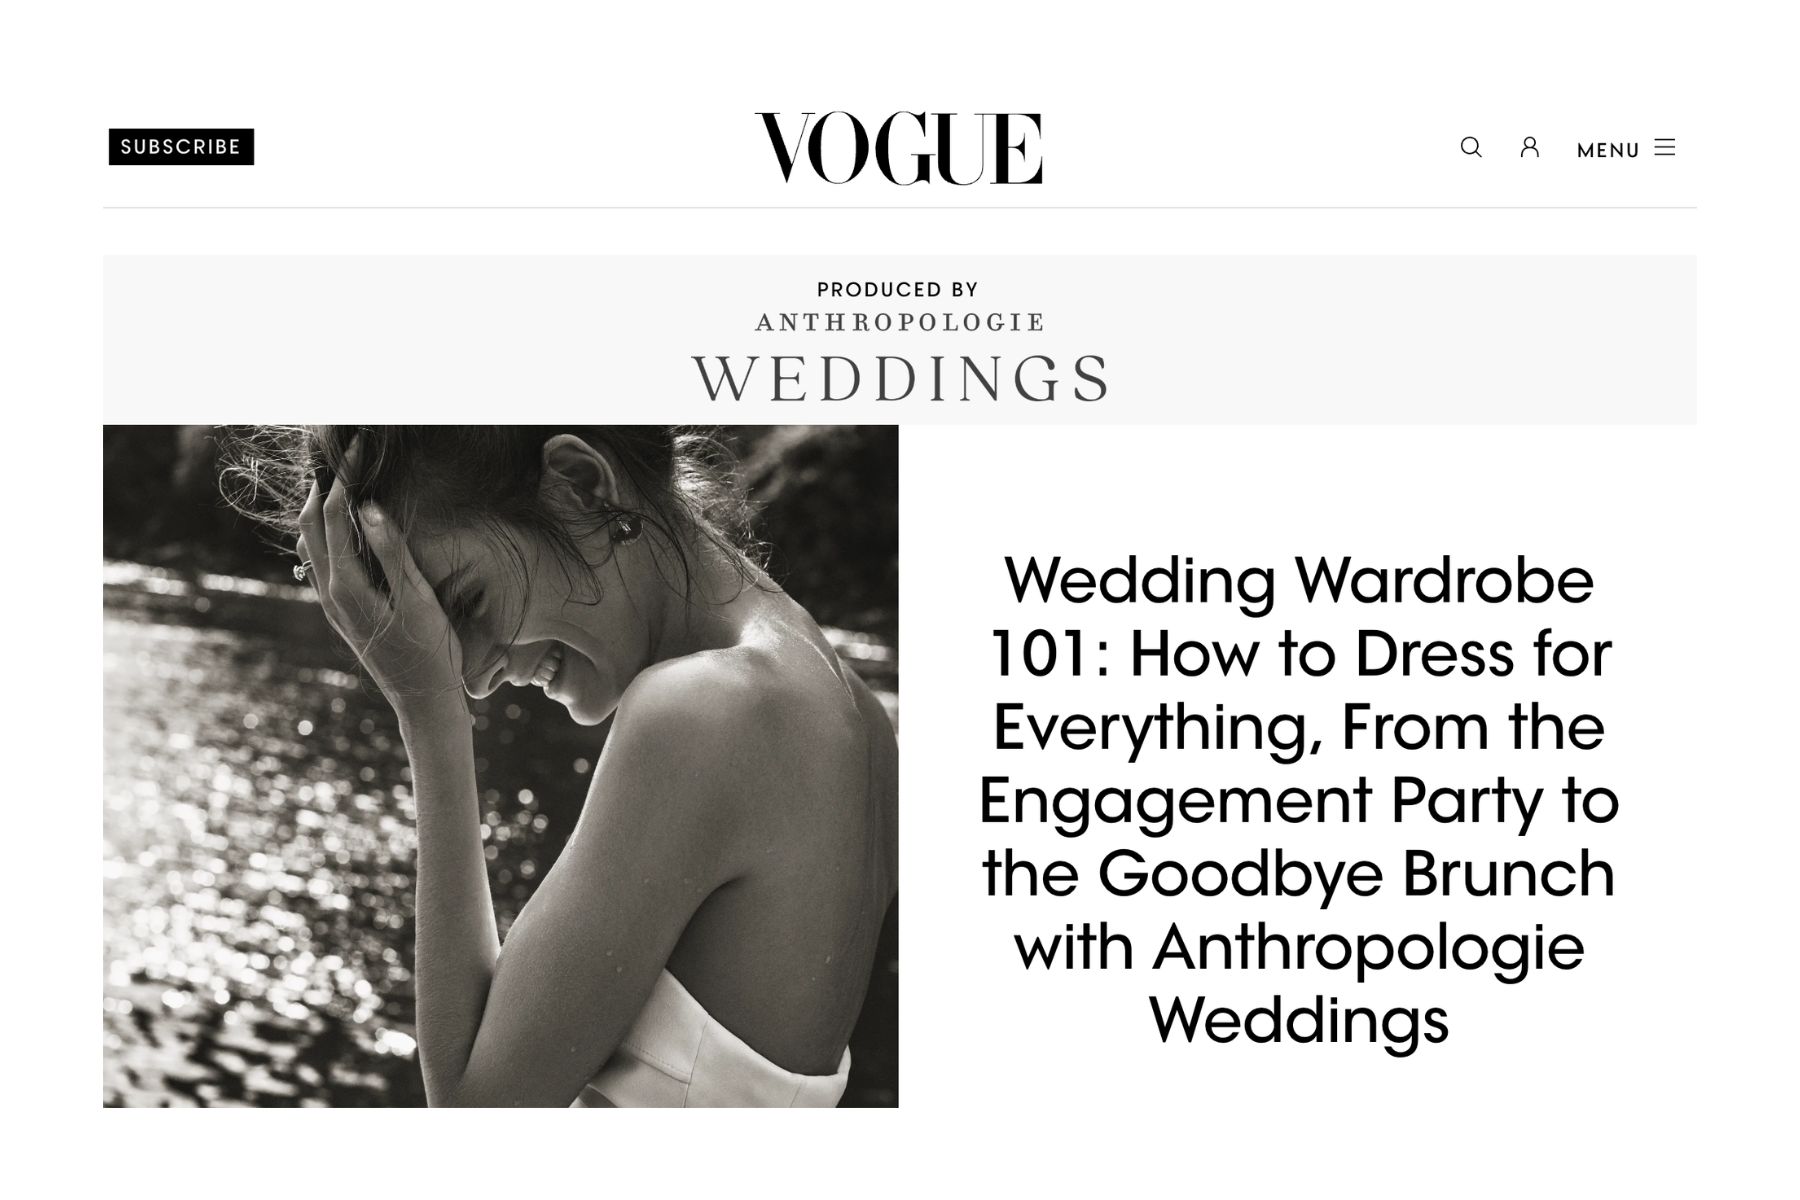
“Wedding Wardrobe 101” among Vogue Weddings’ best-performing articles of the period

Research to insight to content strategy to a brand-partnership story. Zoe led the analysis and advised editorial and client stakeholders on what mattered most.